A forecast is not silence
Geneva filed five million stop events a month for years, and not one of them confirmed. Refusing to count those rows does not measure punctuality — it measures which operators own which hardware.
Every row in the Swiss actual-data feed carries a status, and two of its values decide whether the
row is a measurement at all. REAL means an event fired at the stop — a door signal, an entry or
exit loop — and the operator's system sent the time it happened. PROGNOSE means no such event
fired. The time is the last forecast the system held for that stop, which is also what was on the
departure board.
The obvious rule is to count only REAL. It is wrong, and the reason is in Geneva.
Five million rows, not one event
Until September 2025, the Transports Publics Genevois filed roughly five million stop events a
month, and not one of them with an arrival event behind it. Not because no trams ran: TPG operates
one of the country's largest networks. Because the missing event is a property of the equipment
at a stop, not of the journey. A stop with no door signal and no loop stays PROGNOSE however
plainly the vehicle served it.
Scoring only the confirmed grade would therefore have measured which operators own which hardware. That is the same inversion we have met before: the operators with the thinnest telemetry come out the most reliable.
We checked before deciding
A forecast could just be the timetable written down again. That would not be a measurement and we would not count it. It is not:
- 99.5% of those forecasts differ from the planned time.
- When TPG and Lausanne's tl each began detecting arrival events — on different dates, two years apart — the punctuality distribution did not step. Both systems were tracking their vehicles well before they could confirm them.
So we count both grades, and we keep them apart.
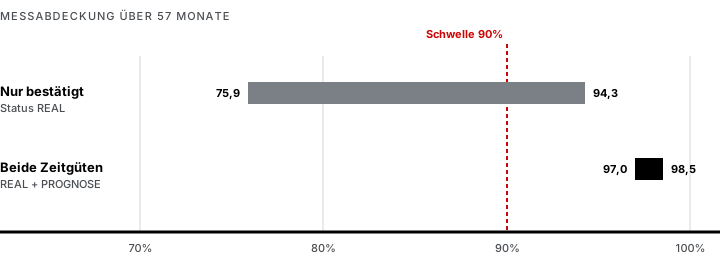
The difference is not small. Across the whole archive the measurement axis — the share of stop events we were entitled to measure and did — goes from 75.9–94.3% to 97.0–98.5%. The published punctuality figure moves by at most 0.45 points, in either direction.
That is where a question of definition becomes a question of legibility. Under the strict rule the measurement axis sits below the 90% floor we require before publishing a figure at all, for most of the archive. The history would not have been wrong. It would mostly not have been there.
What the page says
What we do not do is hide the difference. Every figure can say what share of it fired an event, and it says so because two things are only visible to someone who can see that split: a vehicle may have driven past a stop without the system noticing, and where no forecast exists at all the value sent is the timetable — which we never score, because a timetable is not a measurement of anything.
For June 2026, nationally:
| Punctuality | 84.8% (P3, coverage 96.54%) |
| of it confirmed | 97.71% |
| days in the period | 30 of 30 |
| journeys reaching a timetable | 98.67% |
| share of the country the figure speaks for | 99.97% |
Those five values are not text in this file. They are read from the same cube the API answers from, on every request — because a page that argues for printing coverage next to every figure must not itself carry a figure nobody has re-checked since the day it was typed.
The full derivation is on the methodology page, section 6.